Analytics view
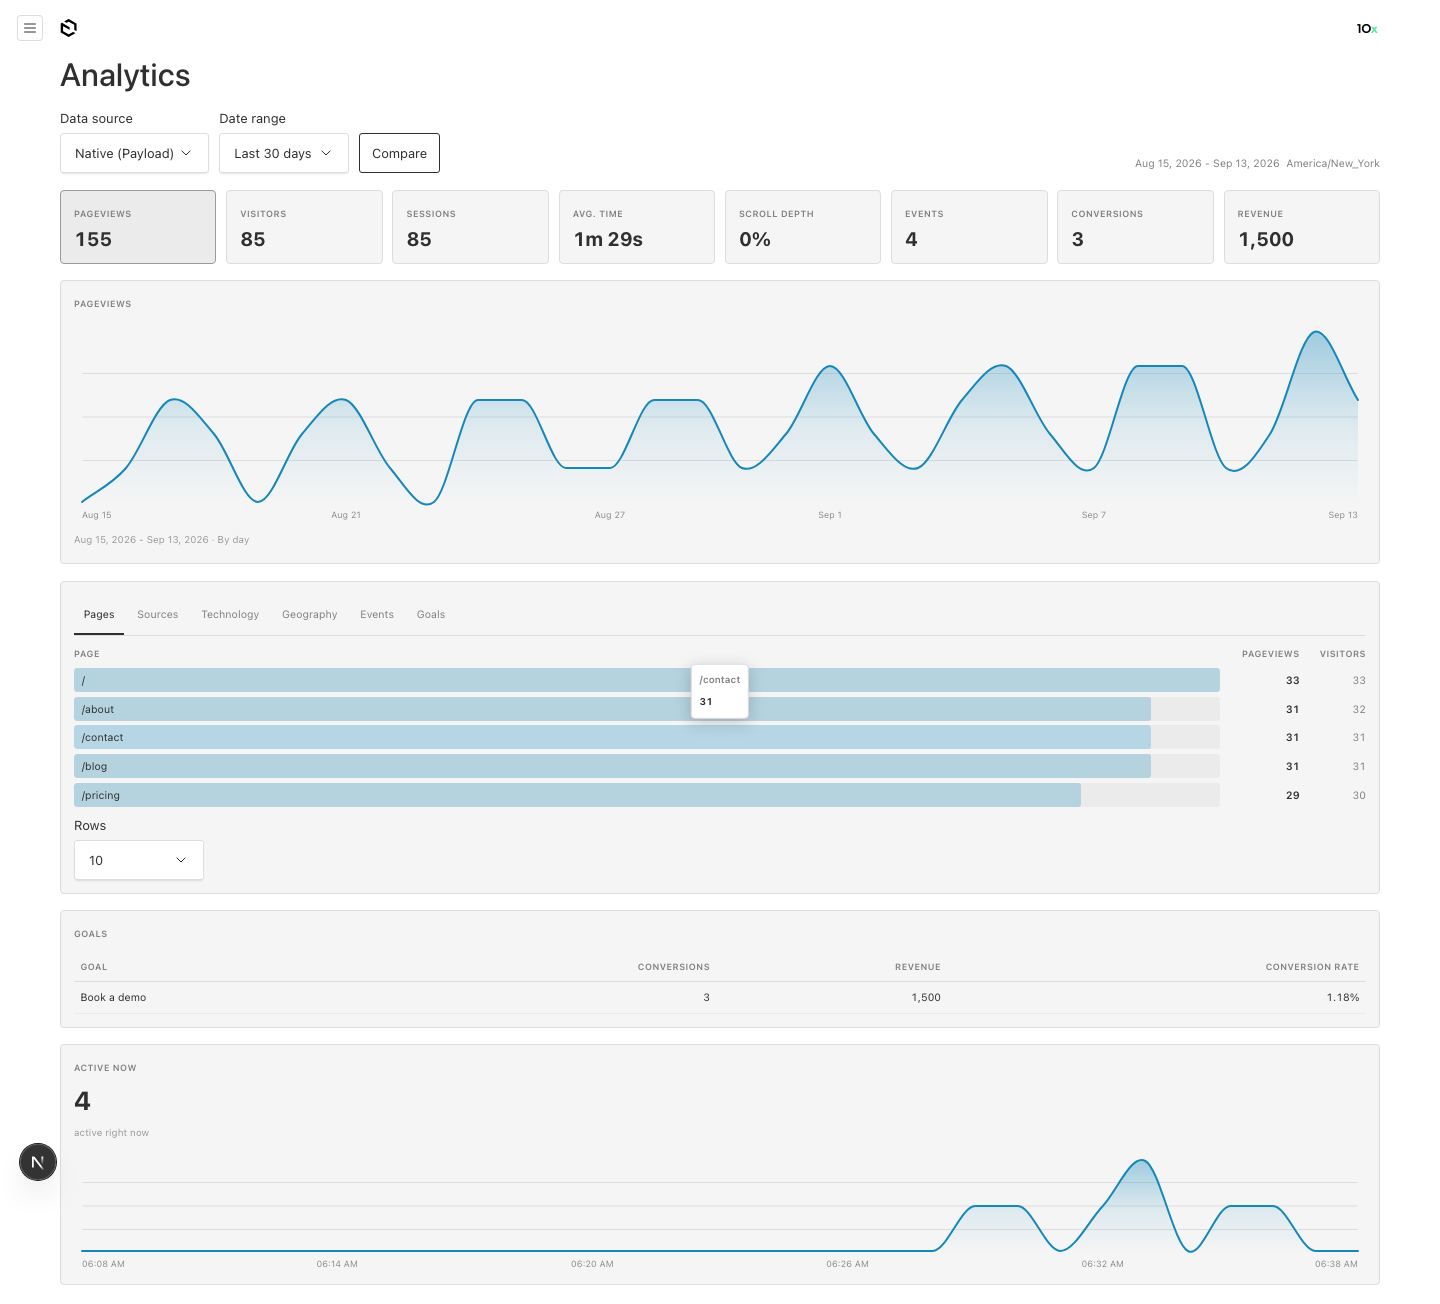
The admin report at /admin/analytics, with overview cards, a trend, breakdown tabs with click-to-filter, goals and realtime, all addressable by URL.
The plugin registers one admin view at /admin/analytics, with an Analytics nav link after your collections. The nav shows that link once: the goals, providers and sync collections sit in a group of their own, Analytics settings (the adminGroup translation). It is the full report the dashboard widgets summarize: pick a source, pick a window, drill into a dimension, and share the result as a link. Every panel but the realtime strip reads through the same authenticated query endpoint your own code would use, so it shows exactly what that endpoint would answer for the signed-in reader; the strip polls GET /api/_x/live, and the server shell resolves the sources and the goal names before the page renders.
It is on by default. Set view: false to remove the route and the nav link.
What it shows
Toolbar. The data source (only when the request resolves more than one), the date range (the presets plus Custom range, which reveals Payload's date picker in range mode, two months side by side), a Compare toggle for the previous period, and a Refresh button. On a scoped install a reader who may read across tenants also gets a Site select, first: their own site, by name, or All sites. Beside them sit the window caption, the reporting timezone the numbers are cut on (its tooltip says what it means: each day's numbers are grouped using that zone), and any filter chips.
Overview cards. One card per metric the source serves, with a period-over-period delta when comparison is on. Clicking a card charts that metric in the trend and sorts the breakdown by it. visits and sessions are one count under two names (every built-in source serves both from the same number, or sessions alone), so the admin calls both Visits and draws one card; a link naming the other one opens on it. A visitors card says how its number was counted: see Notes on the numbers.
Trend. The selected metric over the window, bucketed by hour, day, week or month. The bucket is picked from the window length (hours up to two days, weeks past four months, days in between) and never finer than the source serves. Every bucket of the window is on the axis, a quiet one at zero. By hour the axis runs to the end of the day, the hours still to come drawn empty, so Today just after midnight is one hour on a whole day's axis rather than one hour stretched across the chart. A week or a month the window starts partway through is labeled with the window's first day rather than the Monday or the first of the month before it. With comparison on, the previous period is overlaid on the same axes as a muted line, named "Previous period" in the legend and in every tooltip. A metric the source serves as a range total and not per bucket (Umami's conversions) charts nothing at all rather than a flat line of zeros, which would read as "nobody converted".
Breakdowns. A tab per dimension group the source serves: pages, content, sources, technology, geography, events and goals. Each tab is a ranked table, each row's share drawn as a bar behind its label, with the selected metric, a visitors column where the source serves one, sortable columns and a row limit of 10, 25, 50 or 100. Clicking a row's label adds an eq filter for that value and every section re-reads through it; the chip above removes it again.
The Events and Goals tabs read different columns, because the selected metric is structurally zero for their rows. Events shows Events and Visitors; Goals shows Conversions and Revenue. Neither shows pageviews: an event row has no pageviews of its own, and a goal row counts conversions. The default sort follows the first column, so switching to Events ranks by events rather than by whatever the cards are on. Both tabs also carry a derived Conversion rate column: the row's own visitors over the site's visitors for the same window. It comes from two reads rather than from the source, so there is nothing to sort by, and it is left out entirely whenever either side is missing, unreadable or zero rather than shown as a column of dashes. A source that serves no visitors at all therefore shows the two columns and no rate.
Row values are named rather than echoed. Countries and languages go through Intl.DisplayNames in the admin language, so DE reads as Germany (and Deutschland for a German admin) and de-de reads as German (Germany). Devices, browsers and operating systems go through a translated table that collapses the spellings the sources differ on, so macos, macOS and Mac OS X all read as macOS and Samsung Internet and samsung both read as Samsung Internet. A goal row reads as the goal's name rather than its slug. Anything outside those vocabularies reads exactly as the source stored it, and the stored value is what the filter, the sort and the URL keep either way.
A flag is drawn beside a country name, in the geography rows, the countries widget and a country filter chip. The artwork comes from country-flag-icons and the plugin serves it from its own route, GET /api/_x/flags/<code>, so the admin bundle carries no flag artwork at all: each row loads one lazy, immutably cached SVG. It is decoration, hidden from assistive tech, and the country's name stands beside it either way. countryFlags: false removes it everywhere, and the route with it; countryFlags: { Component } draws your own flag instead (see Customizing).
The Sources tab opens on channel wherever the source serves one, so the first thing it answers is the acquisition mix. Native's rows are its own traffic channel tokens and read as translated names (Paid search, Direct) while the stored value, the filter and the URL keep the lowercase token; a provider classifies into its own vocabulary and its rows read exactly as that provider reports them. source, the visit's named origin, and referrer, the host it came from, are each one pick away in Break down by.
A row the source answered with no value at all reads Not set and is not clickable, since a filter value cannot be empty. PostHog answers that for a pageview captured outside a session.
PostHog has a Sources tab at all only because of channel: it serves no other dimension in that group, so the tab carries no Break down by select there.
A source can group by a dimension without serving the selected metric per row (Umami's /metrics reports distinct sessions and nothing else). The list then charts the first metric of the read that its rows do carry, under that metric's own name, rather than a column of zeros under the name you picked.
A tab opens on the first dimension of its group the source can answer, and a Break down by select beside the row limit switches between the rest whenever the source serves more than one:
| Tab | Groups by |
|---|---|
| Pages | page |
| Content | item |
| Sources | channel, source, referrer, medium, campaign, utmSource, utmMedium, utmCampaign, utmContent, utmTerm |
| Technology | device, browser, os |
| Geography | country, region, city, language |
| Events | event |
| Goals | goal, and currency on an install that measures money |
The pick lands in the URL as dim and is dropped again when it is the tab's default, so the link a reader shares opens on what they were looking at. Switching tabs starts the new one on its own default. Where a source serves only one dimension in a group the select is not rendered at all.
Content. The content items seen in the window, such as offers and banners, with Views, Clicks, a derived Click rate (each row's clicks over its own views) and Conversions. Rows are named by their document's title, read with the reader's own access; a document that was deleted or that the reader may not open reads Removed or hidden item, never as its ref. A filter chip on an item uses the same title. Clicking a row narrows every section to that item's clicks, goals and events. The tab appears only on a source that lists items, which on native means an install that binds a collection as items.
Goals. Conversions per goal over the window, with revenue and a conversion rate against the range's visitors. Goal names come from your config and from the goals collection. Revenue is written in the install's reporting currency, and as a plain number without one. Broken down by currency, each row is the money as it was sent, written in its own currency, and filtering by one currency writes every section's revenue in it. When a revenue figure adds amounts in several currencies that nothing converted, the toolbar says so and names them.
Realtime. An active-now count with a per-minute sparkline, for a source that serves realtime.
Header. The view sets its own breadcrumb, so the admin header reads the nav label rather than whatever crumb the previous screen left behind, and the logo links back to the admin home the way it does on every other view.
URL state and shareable links
Every control writes to the query string, and every read comes from it. A view is its URL: copy the address bar and the person you send it to opens the same report, Back undoes the last change, and a reload changes nothing.
The view writes its steps with the browser's history API, which Next's router follows, so a click changes the address and the reads without asking the server to render the admin page again. Back and Forward restore each step the same way. The one exception is the Site select: which tenant a request reads is resolved on the server, so that step is a normal navigation.
A custom range is written once both of its days are picked, as one history entry: Back returns to the range before it. A first day picked and then left (the calendar closed, or another control used) writes nothing, and the picker shows the committed days again.
| Parameter | Values |
|---|---|
range | today, last7days, last30days, last90days, lastYear, or custom; thisMonth and thisYear read too, though the range select does not offer them |
from, to | YYYY-MM-DD, inclusive calendar days in the reporting timezone. Custom range only |
compare | 1 to compare against the previous period |
source | a source id from the sources endpoint |
scope | *:<tenant>, every tenant at once, tagged with the tenant it was chosen from; a bare * only for a reader whose request resolves no tenant. Any other value is dropped and the address rewritten |
metric | the charted metric, and the breakdown's first column |
granularity | hour, day, week, month. Unset, the window picks one |
tab | pages, content, sources, technology, geography, events, goals |
dim | the dimension the tab groups by. Unset, the tab uses its default |
filters | JSON array of { dimension, operator, value }, up to 10 |
limit | 10, 25, 50, 100 |
order | <metric>:asc or <metric>:desc |
Anything equal to the install's default is left out, so an untouched view has a clean URL. The parser is total: a value that names no metric, tab, dimension, operator or calendar day falls back to the default instead of failing, so a truncated or hand-edited link still opens a working view.
A link built for one source keeps working when it is opened against another. Values the selected source cannot serve (a metric it lacks, a filter it cannot apply, a comparison whose previous window it cannot reach) are coerced to what it can, and the address is rewritten to match with history.replaceState, so the address always says what is on screen and Back does not undo the correction. Opening the original link again brings its values back.
Capability gating
Every control reads the selected source's capabilities rather than the contract, so a provider that serves less gets a smaller view instead of controls that fail at the endpoint.
| Control | Appears when |
|---|---|
| Data source select | the request resolves more than one readable source |
| A metric card | the metric is in capabilities.metrics |
| Compare | every source, unless its adapter set comparison: false. Hidden for a window whose previous period starts before the source's maxLookbackDays |
| A range preset | its window fits capabilities.maxLookbackDays |
| A breakdown tab | the source serves at least one dimension in that tab's group |
| Break down by select | the source serves more than one dimension in the active tab's group |
| Row click, filter chips | the dimension on screen is in capabilities.filters. Otherwise rows are inert and a caption says so |
| Trend granularity | never finer than capabilities.minGranularity, and never finer than an hour |
| Goals breakdown tab | goal or currency is in capabilities.dimensions, like any other tab |
| Goals panel | goal in the dimensions and conversions in the metrics |
| Conversion rate column | on the Events and Goals tabs, and only where the source serves visitors for both the rows and the range total |
| Content tab | item in capabilities.dimensions; its click rate wherever a row carries both views and clicks |
| Realtime strip | capabilities.realtime |
Options
analytics({
  adapters: [native()],
  capture: { gate: 'all' },
  view: {
    path: '/analytics',          // admin path, under routes.admin
    defaultRange: 'last30days',  // timeframe the view opens on
    defaultMetric: 'pageviews',  // metric the cards and trend open on
    navLabel: { en: 'Analytics', de: 'Statistiken' },
    navLink: true,               // false: no link in the admin nav
    // Component: '/components/MyAnalyticsView#MyAnalyticsView', // your own body, see Customizing
  },
  countryFlags: true,            // flags beside country names (default); false, or { Component }
  access: {
    view: ({ req }) => req.user?.role === 'admin',
  },
})
defaultRange takes any timeframe preset. The toolbar offers five of them: today, last7days, last30days, last90days and lastYear (shown as Last 12 months: the year up to today, not the previous calendar year). thisMonth and thisYear open the view on that window, though the range select does not list them. allTime opens on last30days, because the query endpoint refuses any window longer than a year.
view: false removes the route and the nav link entirely. navLink: false keeps the view at its path and leaves its link out of the admin nav, for a host that links it from navigation of its own; there is no need to filter admin.components.afterNavLinks for it. navLabel names the nav link and the view's breadcrumb: a plain string, or a map keyed by admin language code, read in the reader's language, then Payload's fallbackLanguage, then en; unset, the plugin's own translated label applies, localizable through the translations option. The view's heading and its tab title stay viewTitle.
countryFlags is a top-level option rather than a view option, because the widgets and the per-document panel draw flags too, with or without the view. It takes a boolean or { Component }, and anything else is rejected at config time. It covers the geography rows, the countries widget, the document panel and a country filter chip; false removes the flag from all of them and leaves the name alone. The flag route is mounted only for true: false needs none, and a component of your own brings its own artwork (Country flags). It is public and static by design, reading no database, no user and no scope, so there is nothing behind it to gate.
access.view gates the view and defaults to access.read, so one gate covers the view and the endpoints behind it. access.read in turn defaults to isAdminUser, the users of the admin collection (admin.user), so a user of any other auth collection reads nothing. A reader it denies still sees the nav link (it is a client component with no access context) and lands on the view's no-access message. Narrowing access.view alone hides the report while leaving the widgets and display fields readable; narrowing access.read closes all three, since every widget and display field read asks it too. An access.view wider than access.read opens the page and nothing on it: the goal names and the site names are read data too, so the shell resolves them only for a reader access.read admits, and every section's read asks it as well.
After enabling or moving the view, regenerate the import map so the admin resolves its components:
pnpm payload generate:importmapMulti-tenancy
There is no scope picker. The host owns which tenant a request is for, through whatever selector it already has, and the view reads whatever scope.resolve answers, exactly as every other read surface does. Switching tenants re-reads every section in place: the view is keyed on the resolved scope, so a router.refresh() that lands on a different tenant cannot leave the previous tenant's numbers on screen.
On a scoped install the view captions itself with that scope under the title (Showing: Alpha). The name comes from the host's own scope.label; without that option the caption falls back to the scope string itself. A reader who may aggregate and has no tenant selected reads Showing: All sites. A reader who gets the Site select below gets no caption: the select already says which site the numbers belong to. A reader who works per site and has none selected, such as a tenant admin signed in without picking one, sees Choose a site to see its numbers. in place of the sections, rather than the note that no source is connected; the dashboard's widgets and the document panel say the same.
The one scope decision the view makes for itself is whether to aggregate. A reader access.crossScope.aggregate allows, and whose own scope is a tenant, gets a Site select first in the toolbar, a Payload select like the source and range beside it, offering their own site under its scope.label name and All sites. All sites writes scope=*:<tenant> and nothing else, the aggregate marker tagged with the tenant it was chosen from; their own site writes no scope at all.
Four URL rules follow. That tagged marker is the only scope an address may carry: any other scope is dropped on the server. A source the resolved scope does not hold, and a metric, grouping or filter the selected source cannot serve, are dropped in the browser. Either way the address is rewritten to what actually answered, with history.replaceState, so Back does not undo the correction. A marker tagged with a tenant the request no longer resolves to is dropped as well, so moving the host's own selector drops the All sites choice rather than carrying it into another tenant. And a reader the aggregate gate denies who opens an aggregate link gets their own tenant's numbers and an address that says so, rather than a refusal.
The source select lists that request's sources, which on a scoped install are the provider documents that tenant holds and this reader may read, each under its document name; another tenant's never appear, and neither does a config adapter whose queries cannot narrow to one tenant. One source draws no select at all. The view opens on the tenant's default source.
Where a fallback policy lets a tenant's own users read the platform's adapter because they have no source of their own, the view tells them so: these are the platform's numbers until they add a source, and adding one switches to it. The providers list says the same. Goal names are resolved per scope too. See Multi-tenancy for how the scope itself is resolved.
Keyboard
Every control is in the tab order with a visible focus ring, in reading order: the toolbar, the overview cards, the trend, then the breakdown's tabs, sort buttons and rows.
- Breakdown tabs are a proper tab strip: one tab stop, then the arrow keys move between tabs (wrapping at both ends), Home and End for the first and last.
- The trend takes focus as one stop. The arrow keys walk its buckets and show each one's tooltip, Home and End jump to the first and last, Escape clears it.
- Sort and filter are buttons: each sortable column header holds one, and each row's label is one that adds the row as a filter.
On a right-to-left page the arrow keys follow the reading direction: Left is the next tab and the later bucket. The site, source, range, group-by and row-count selects are Payload's own select inputs, which are react-select comboboxes rather than native <select> elements, each named by a label of its own. A custom range is picked in Payload's date picker in range mode: one text input that opens a two-month calendar, whose days, months and arrows are named in the admin's language, and which commits the range once both days are picked. Everything else is a button.
Accessibility
The view is built from real tables and plain text a screen reader can walk, with nothing announced that the reader did not ask for:
- Tables. The breakdowns, the goals panel, the dashboard's lists and goals table and the document panel's lists are
<table>elements. Their columns have headers, and each row's label is its row header (<th scope="row">), holding the row's filter button where the source can filter by it. The column the rows are ordered by carriesaria-sort, including the default order, and its header button carries the column's name alone. A row's share is drawn as its label cell's background, not as an element of its own. Where a card is too small to show the header row it stays in the table for assistive tech. - Charts. Every trend chart is one named, focusable image whose drawing is hidden from assistive tech; beside it a visually hidden data table holds the same numbers, a row per bucket with the previous period as a column. The tooltip the keyboard walks is not a live region.
- Live counts. The realtime numbers on the view, the dashboard and the document panel are not live regions themselves. A visually hidden region beside each says the count when it changed, and at most once a minute, so a poll every fifteen seconds never talks over the page. Two counters on one page take turns, a few seconds apart, rather than speaking at once, and a pageview count names the minutes it covers (12 pageviews in the last 30 minutes).
- Refresh. A refresh that worked is said once to a screen reader (The numbers are up to date.) and shown nowhere; one that failed is shown and said.
- Contrast. The period-over-period deltas are Payload's
Pillin its success and error styles, the unchanged one in its light gray, each at least 7.7:1 in the light and the dark theme. - Right to left. Payload marks an Arabic, Persian or Hebrew admin
dir="rtl", and the view follows it: the stylesheet uses logical properties throughout, the charts run their time axis from the right, bars grow from the right with their labels mirrored, and the arrow keys swap as above. A row label keeps its own direction, so/pricingreads as/pricingin an Arabic table.
Notes on the numbers
Notes appear beside the range caption:
- A Showing saved data pill: at least one section was served from an expired cache entry because the provider could not be reached. The numbers are the last good answer, not a failure; see Caching.
- "Only data from Mar 3, 2026 onward is shown": at least one section read a shorter window than the one you asked for, because the source cannot look back that far or the native engine could no longer cut a day at the window's edge. It names the days kept, in the reporting timezone: "Only data up to Mar 9, 2026 is shown" when the end moved, both dates when both did, and "Showing the longest time period this tool allows" when the source said neither. The cards and the chart describe the narrower window.
- "Some days are still being counted": the native engine left days out because counting them would have taken too long for a page view; they are counted in the background and appear on a later visit.
- "Some days could not be counted, so they are missing or show older numbers": counting those days failed again and again until the native engine gave up, so each shows an earlier count or nothing.
- "Some rare values are grouped together": on some days a value you read about was folded into the daily totals'
(other)row and its raw hits are gone, so its numbers can be low. - "Times are shown in UTC": the site's reporting timezone could not be found, so the days were cut in UTC for now.
- "Revenue adds up amounts in different currencies": the revenue figures add amounts nothing converted, and the note names the currencies.
- "Updated 3 minutes ago": today's numbers come from a snapshot taken that long ago, which a busy day is read from.
Each note is said once, however many sections carry it.
The number's own name carries one caveat. The native engine counts each day's visitors on their own, so over more than one day its visitors are those daily counts added up: a person who came on two days counts twice. Wherever a read says so (meta.visitorsAre: 'sumOfDaily'), the card, the column and the widget call the number Visitors, counted per day instead of Visitors, so someone who comes back on another day is plainly counted again. A trend by day or by hour charts each day's or hour's own visitors and keeps the plain name; by week or month it takes the counted-per-day one. A source that counts each person once over the range keeps Visitors throughout.
A section that fails on its own keeps whatever it was showing and adds a retry: a transient 503 dims a panel rather than blanking the page, and a source that cannot answer one section at all leaves that section empty while the rest of the view carries on. Switching to another data source is different: every section clears at once and waits for the new source's answer, so its failure is never shown beside the previous source's numbers.
What a failure says follows its error code, in words a site owner can act on: what happened and who can fix it. A read the source refuses as asked asks for other filters or another range; a source that is not set up correctly says so and points to its settings or the person who connected it, and a refused host is named as an address the site may not contact, for the developer to correct or allow; a missing source or a reader without access gets that, with no retry; an outage and a scope with too many reads waiting offer a retry, with the wait the endpoint sent.
Refresh
Refresh retires the reader's own scope's cached reads through POST /api/_x/refresh, then reissues the cards, the trend, the breakdown and the goals table, which reach the source rather than the cache. The button reads Refreshing and ignores further presses until the call settles. It is marked aria-disabled rather than disabled, so a keyboard user is still on it when it comes back. A failure leaves an error banner in the toolbar, in a live region, rather than changing what is on screen. It sends no scope, so a tenant refreshes their own scope and nothing else.
What it does not reissue:
- The realtime strip. It polls on its own schedule and is bucketed to the realtime TTL, minutes at most. Its next poll reads through to the source, the same as every other surface.
- Dashboard widgets already rendered. They are server-rendered, so each picks the bump up on its next render; a dashboard open in another tab keeps the numbers it drew until it re-renders.
Nothing is fetched by the refresh itself. It invalidates, and the reissued sections are what pay the cold round trip. See Invalidation for what else retires cached reads.
Your own visits
With capture.exclusion on, the view ends with a Your own visits panel, and without it the panel is not there at all. It asks GET /api/_x/exclusion for the reader's own scope's token when it loads. On a multi-tenant install's all-sites view, a reader who may name every tenant gets every tenant's sites, each with its own token.
Where the admin knows a site's address, from capture.exclusion.sites or, on a scoped install, because the site runs on the admin's own origin, the panel shows one row per site:
- Stop counting this browser opens the site's signed link in a new tab, where the site's own tracker stores the flag in that site's storage.
- Count this browser again opens the site's
=0link the same way, which clears it. - Copy link for another browser copies the signed link, to open in another browser or send to a colleague.
Both are plain links, and the admin never reads or writes the site's storage: a site on another origin keeps its flag where only its own pages can see it. Do it once in each browser you use.
Otherwise the panel hands out the part to add to the site's address, ?analytics_exclude=<token>, with Copy link, and below it ?analytics_exclude=0, which counts a browser again. Add it to the end of your website's address and open that once in each browser you want to leave out.
Safari may delete storage a script wrote after 7 days without a visit to that site, so a browser that has not opened the site for a week may need the link again. Staff who visit their own site keep the flag.
The endpoint is gated like every read, and by access.view on top: authentication, access.read, access.view, then the scope. It never answers another scope's token unless access.crossScope.named grants the reader that scope, refuses scope=* because a link belongs to one site, and answers Cache-Control: private, no-store.
Customizing
The view's look follows the plugin's tokens and classes. view.Component replaces its body with one of your own, composed from the sections @10x-media/analytics/client exports, under the same server shell (The analytics view's body), and countryFlags: { Component } draws flags of your own (Country flags). Both are @beta.